
To know where we are headed, it helps to know where we have (really) been.
Welcome to 2022. A year that will reward the disciplined and remind us all of why a plan is so critical for long-term financial success. Let’s recap the bizarro world we have witnessed over the past two years, the decisions made, and the repercussions and consequences capital markets will face as a result of those decisions. Then, let’s wrap up with what you should consider as we embark on the journey through the year ahead.
Suppose you were approached by a scraggly, disheveled-looking character who informs you he has literally been living under a rock for the past two years. In desperation, he asks you to explain all that has gone on in the past twenty-four months. Chances are, you might be at a loss for words. Perhaps you manage to mutter a few descriptives - whacky, scary, unusual, bizarre? While we may all have slightly different approaches for helping our new friend, if you wanted to offer evidence of just how unusual the past two years have been, the capital investment markets would offer an outstanding showcase.
Some of the events we have seen have been downright absurd, others curious, and still some have left us all in disbelief. But what if I told you that almost all of the strange events seen over the past two years in the investment marketplace share a common thread, tying them all together?
The Carriage House Planning Report is back in 2022 (after a long break) to recap the past two years, uncover the hidden truth underpinning almost all of the major investment stories since COVID began, and to highlight what direction the weight of the evidence currently suggests we are heading.
Additionally, below you will find a number of charts of interest we believe either add context to our conversation or are simply relevant enough to shed light on. We hope you enjoy the January episode of the Carriage House Planning Report!
Charts of Interest

Key members of the Federal Reserve were recognized to be making lucrative investments on what could (should) be considered insider information, leading to them stepping down before the end of their respective term limits. While this is a problem on its own, the fact that they were profiting suggests they may have placed pressures on policymaking decisions that would prove profitable to markets. Will their absence change Fed policy making in 2022? It is not likely, but it should be considered.


M2 money supply is a critical measure when understanding inflation. Inflation is not created by government spending, nor is it created by “companies participating in price gouging” as some of the finger-waggers in DC will proclaim. Money supply, or an excess of, creates inflation. There is a key difference between the “money creation” of the 2008/2009 Great Recession and that of the 2020 “pandemic relief”. The 2008/2009 efforts did not drastically increase the money supply in broad circulation. The chart above shows 3 separate measures of M2 money supply and the radical difference between 2008/2009 and 2020 are very apparent.
Below, we can see just how drastic the differences are:


We need to be cautious of looking at indices (or Index ETFs) as a proxy for general market health. Markets and icebergs have a lot in common. The thing you see, be it the Dow Jones Average, S&P 500 Index, or Nasdaq 100 is just the tip floating above the water. When we look below the surface, we may find a different story as evidenced by the sideways chop seen in the Value Line Geometric Index from March 2021 while the S&P 500 was in a steady uptrend until beginning a sideways chop in November 2021.

Large-caps and small-caps can tell similar stories, but at different times. The small-caps signaled that there may be a rotation from growth to value as early as mid-2021. We can see that the large-cap space may have recently confirmed this. While nothing is certain, the evidence is weighing heavily in favor of a value versus growth.

Treasury Yields should be watched closely.
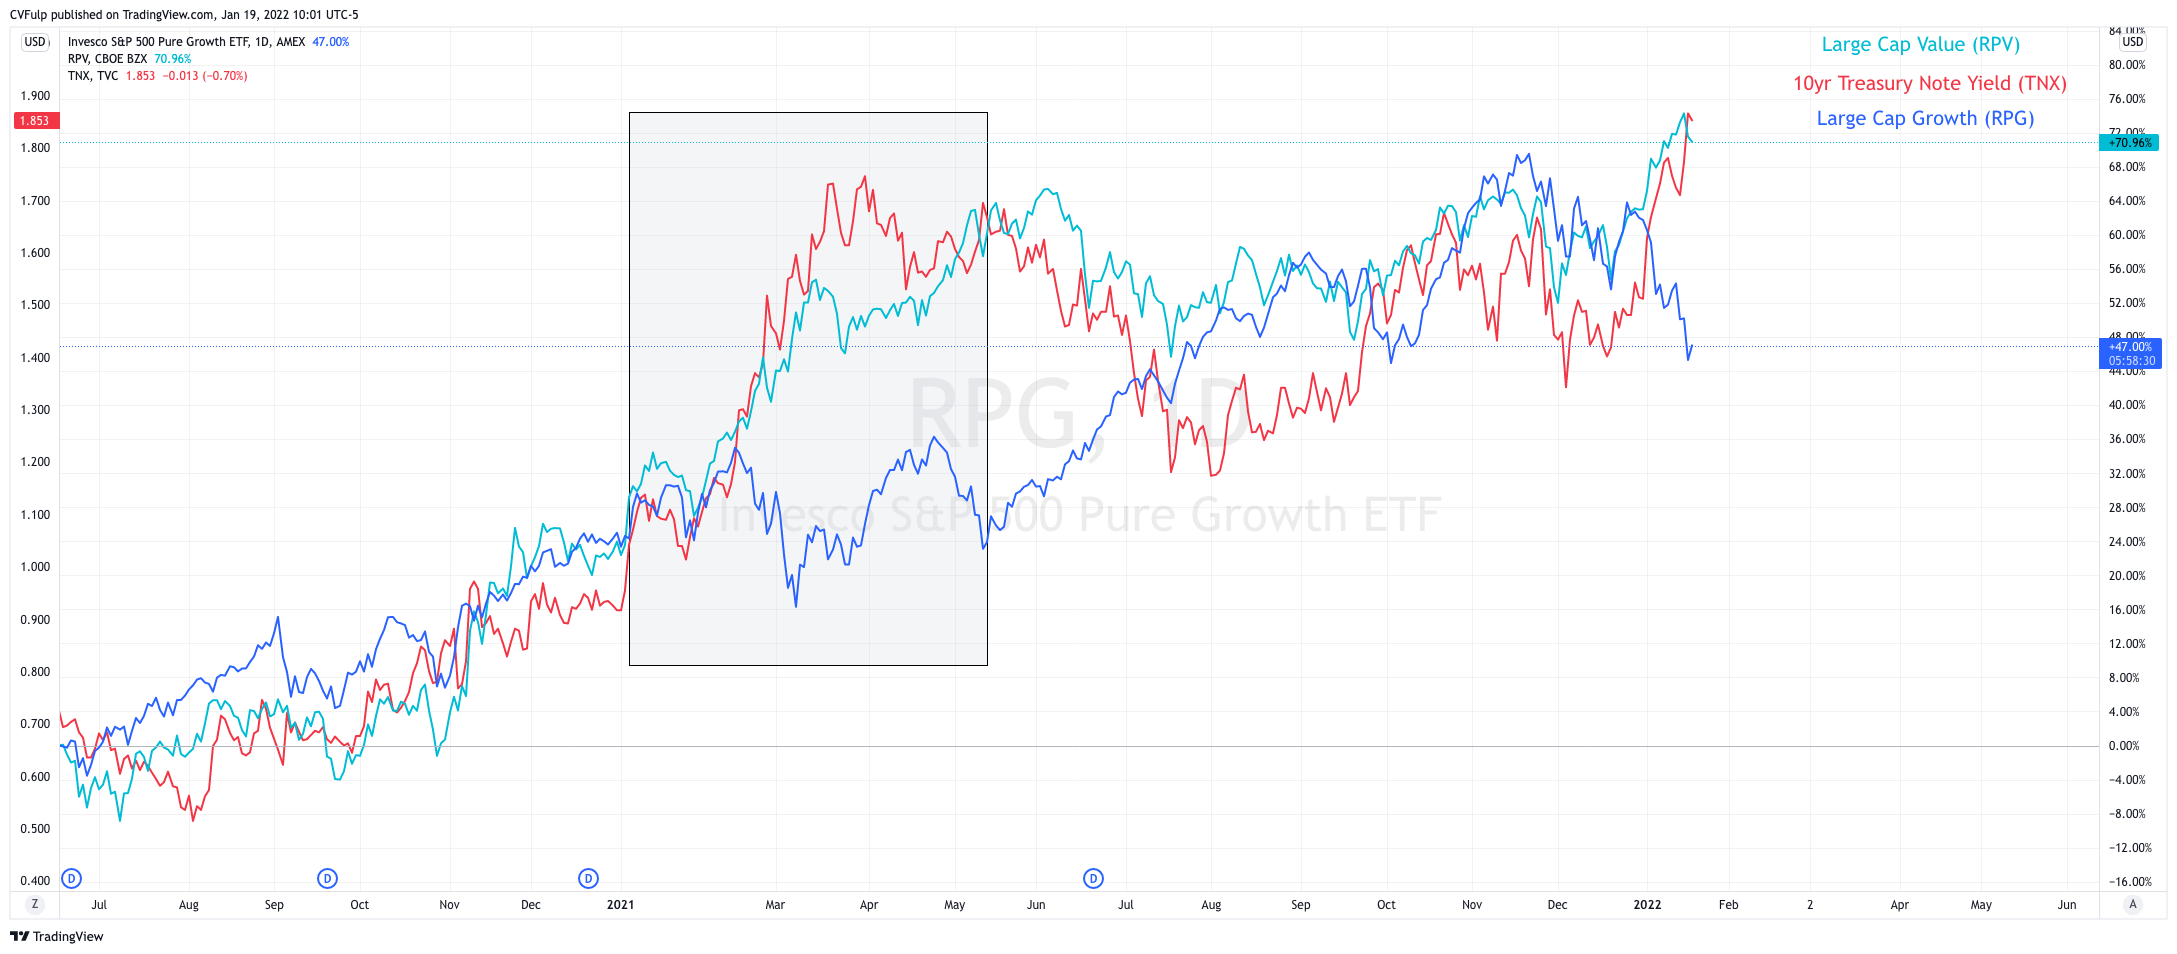
The yield on the 10yr treasury spiked in early 2021 ushering in significant strength in value stocks compared to growth. However, as yields quickly reverted, so too did the strength in value stocks allowing growth stocks to surge back into dominance. That is until yields began spiking again.