
Timely Observations - Selling pressure in Nasdaq 100
Regarding Nasdaq 100, the following is a chart of two coinciding Elliott wave patterns (minor represented by fat blue line and numerals; major represented by skinny blue line and roman numerals).
In mid-April, I marked two supports (orange / red lines) as well as the resistance zone for wave 5 of the minor wave event (green outlined box). The minor wave successfully completed fulfillment eking out a new high April 29. Since then, you will see it has confirmed this wave pattern completion by violating both of the key supports (yellow & orange lines). This provides a clue to look toward the major wave for next area of support.
The major wave cycle beginning from late September lows is in process of fulfilling its 5th wave cycle. It should be noted the significance of yesterday’s open/close, which perfectly fill the notable gap-up the NDX saw between close 1/19 and open 1/20 (orange outlined box), which could be a clue that short term selling pressure will abate.
So long as the NDX does not violate the 4th wave cycle low of $12195, the pattern remains intact, suggesting the potential to move above $13881. I currently calculate an upside target of approximately $14250

NASDAQ 100 (NDX) (Daily Chart)
Additionally, I thought the following to be a very interesting development in the conversation of Growth vs. Value. The following is a chart of RPG/RPV. Note the significance of the blue horizontal line beginning just before the surge up in growth resulting from the government imposed shutdowns (3/20). The volume weighted average price suggests this $2.02 level could be/should be violated, but it makes a case for one last push from growth before the ultimate value shift becomes fully underway. Will wait to see.
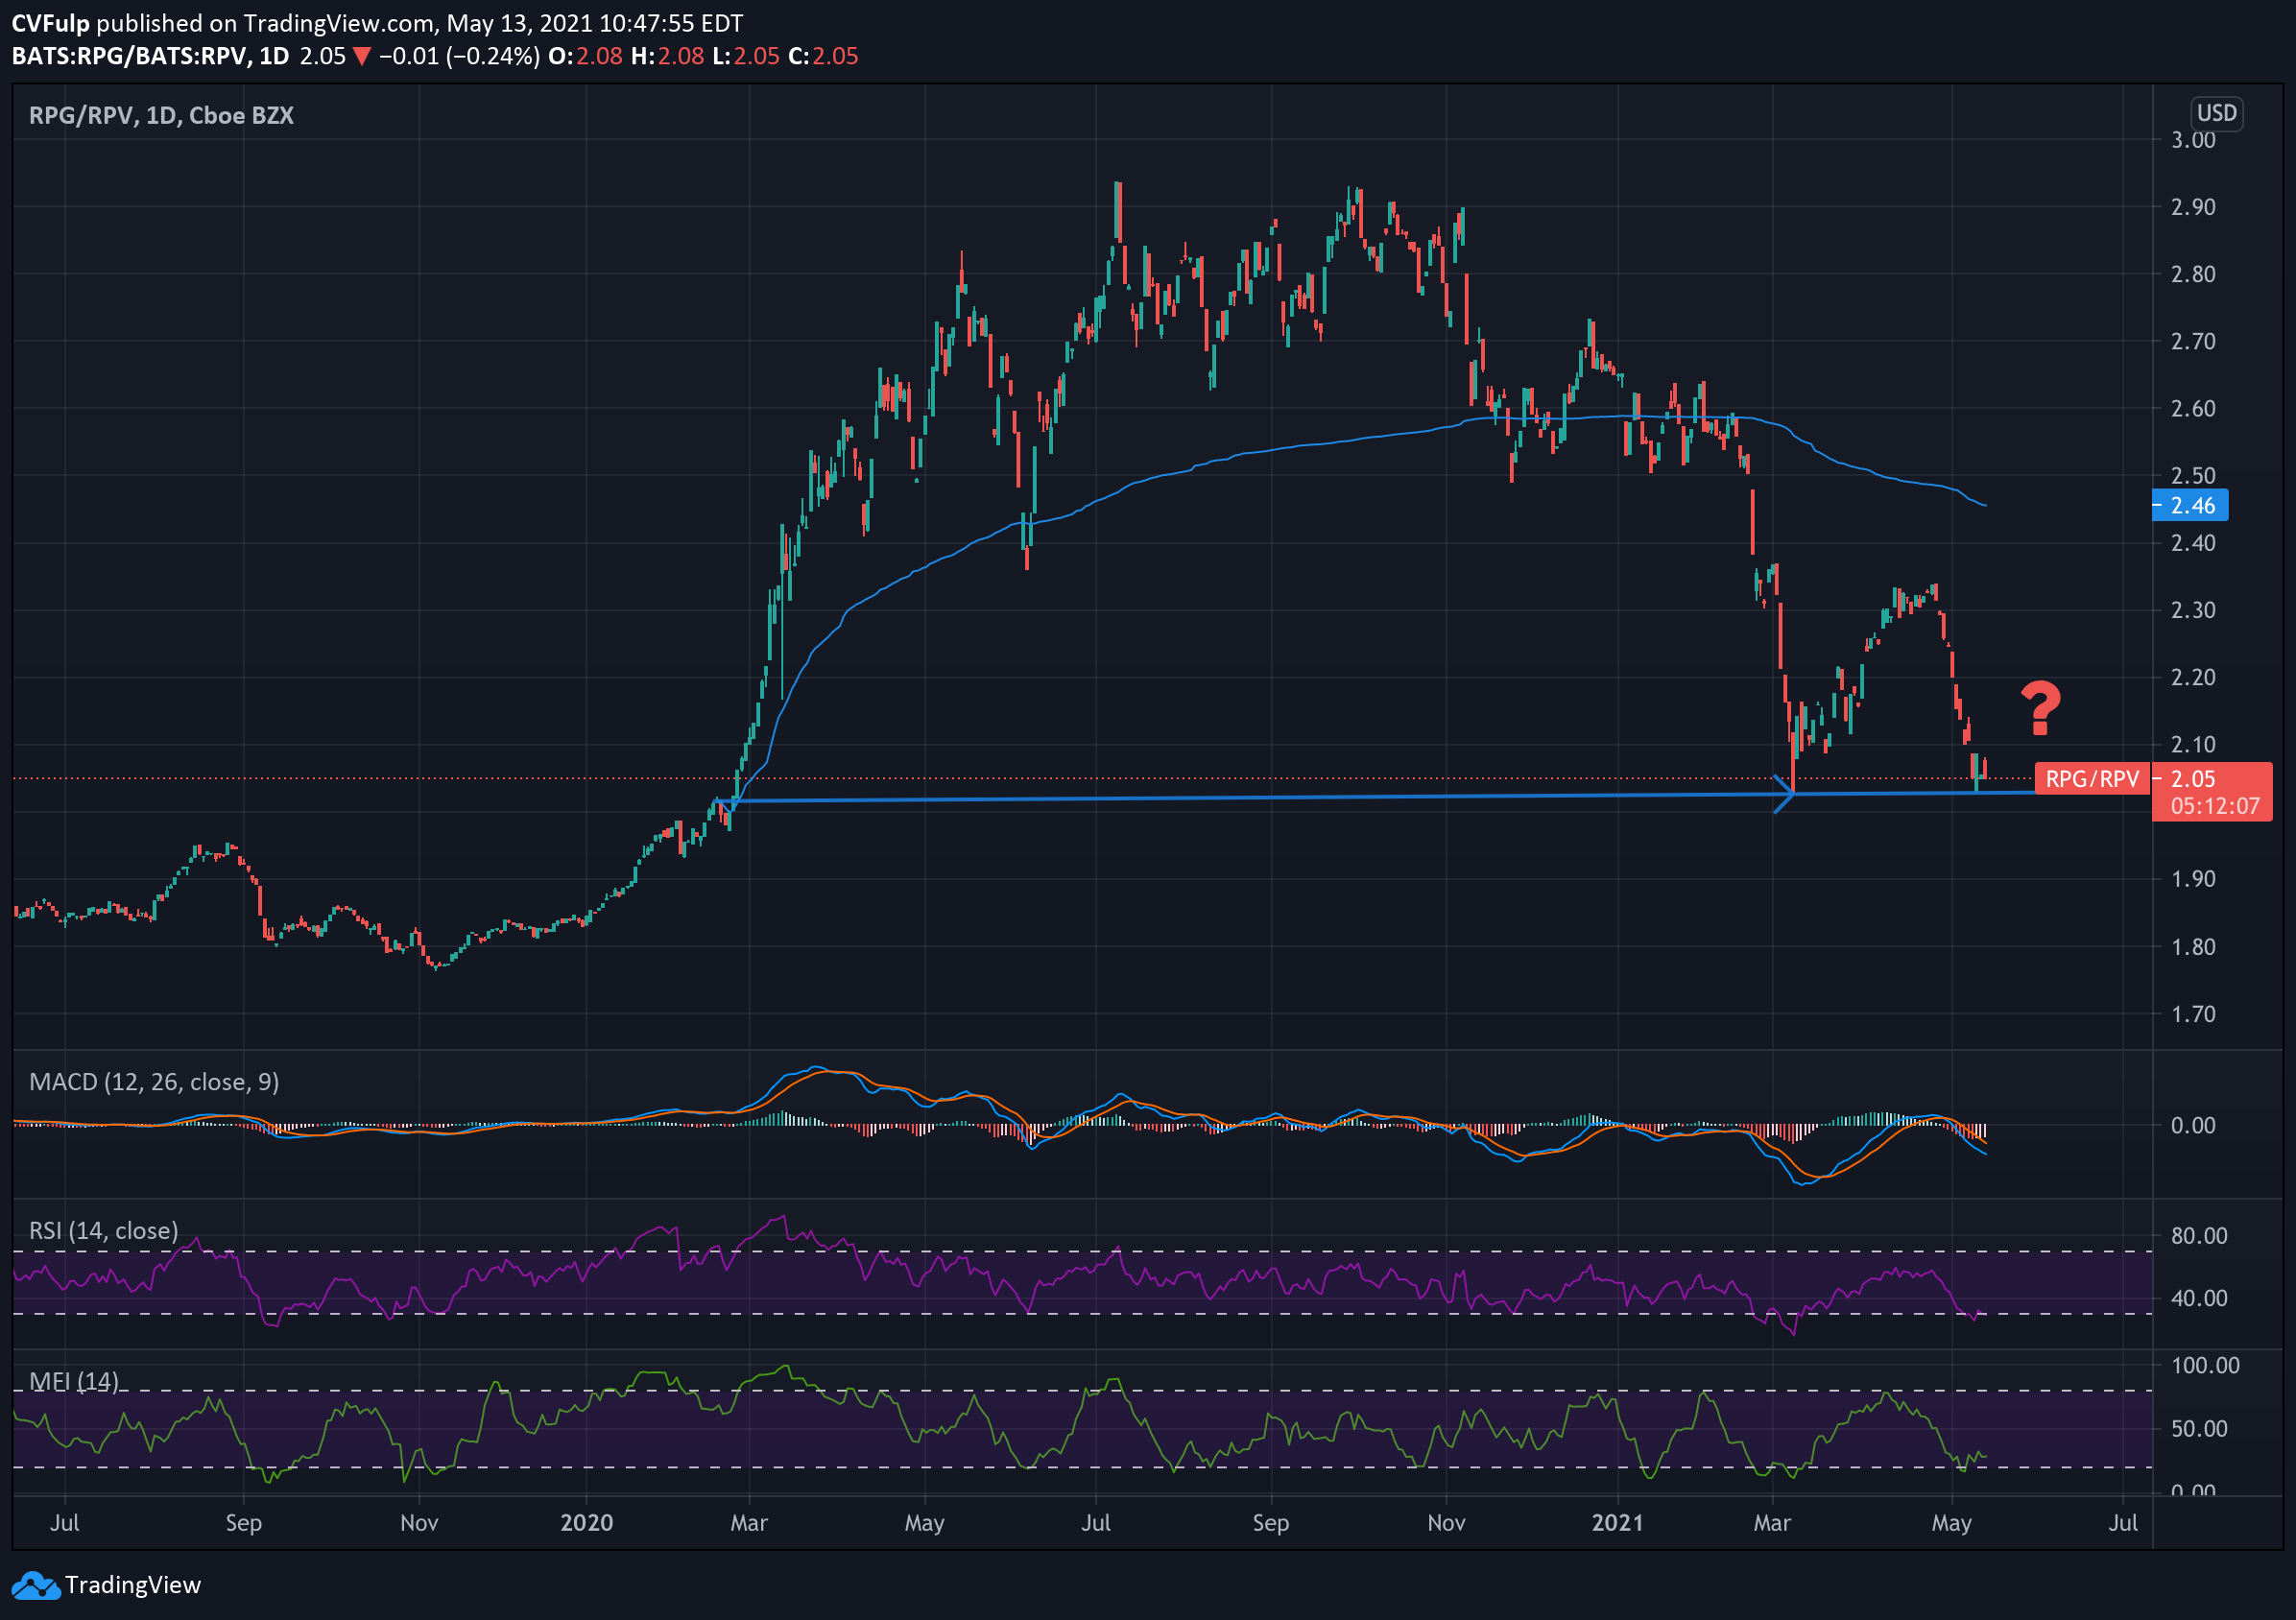
S&P 500 Pure Growth/S&P 500 Pure Value (daily chart)