
Weekly Roadmap
What a week it has been. In the investment world, we have seen the cryptocurrency market once again take center stage. China has declared war (in a sense) on cryptocurrencies as the United States government, true to form, seeks revenue by taking aim at taxing transactions denominated in digital currency. Meanwhile, the Federal Reserve ordered an official study to be conducted on how they can create their own digital currency. Then, let’s not forget about the modern golden boy of all things electric - Elon Musk - openly manipulating the crypto market 280 characters at a time. While many investors laser eyed the digital currency world, they may have missed what I believe to be far more relevant and important developments.
In this edition of Weekly Roadmap, I will review:
The Growth vs. Value Secular Trend Shift
Treasury Yields
Critical Support & Resistance Levels for Key Market Indicators
Growth vs. Value
First off, let’s revisit the ongoing conversation around Growth versus Value and what has been happening. I suggested in a recent post that the Growth market would likely see a rebound into late May, early June. By proxy if we look at the NASDAQ-100 Index (NDX), flush with big tech growth names, we can see this rebound is underway. I have a price target of roughly 14,100-14,250 for the NDX. If this price target is fulfilled, we will have completed the fifth leg of the major Elliott Wave that began back in late September 2020. Once fulfilled, it is likely the NDX will see weakness, so for this reason I remain neutral on growth. I see this rally as an opportunity to sell off any remaining exposure, unless doing so generates significant capital gains. I make this distinction as I do not foresee a precipitous sell-off as imminent and the long-term, multiyear outlook remains positive, but I do expect sideways movement over the months to come (perhaps longer), in the event this price target is reached - preferably over the next 3-5 weeks.

NDX Target and Supports
This would also suggest that the Growth versus Value battle has not yet declared a victor. However, to use a sports analogy, we may be in the fourth quarter of a football game, 3 minutes on the clock and the score is 7 (Growth) to 14 (Value). Growth has the ball on the 35 yard line, but it’s 4th down and they just sent out the kicker. Yes, they could run a trick play and tie up the game, but in all likelihood, they will kick a field goal and hope the onside kickoff is fruitful. Probability, however, suggests it won’t be, and Value will end up winning the game.
To put this analogy in chart context, the following is the price of the S&P 500 Pure Growth(RPG) divided by the price of the S&P 500 Pure Value(RPV). A move up is favorable for Growth, moves down are favoring Value. If we look at the daily chart (each bar, red or green, represents one trading day), we can see that Growth is trying to build some steam. We can also see that there is a clear support line(s) around 2.02-2.03. While this is favorable to Growth, the more times we bounce off this support, the weaker it gets. This support is not likely to hold another tap, and will likely break, which would be a significant positive for Value.

RPG/RPV Hard Support
You may be asking, “What about the small-cap stocks? Small caps have been leading the charge for a good portion of 2021.” And you would be correct. So let’s look at the relationship between the Russell 2000 Growth (IWO) and the Russell 2000 Value (IWN). In the following chart, you may see what appears to be an even more aggressive move up, favoring Growth. You may be inclined to call into question whether this shift to Value dominance has legs:

IWO/IWN Daily Chart
However, because the small caps by nature exhibit a greater amount of volatility, we may gain a better perspective by looking at the same chart on a weekly (rather than daily) basis. In doing so, you can now see that the recent rally growth is not as robust as it initially appeared. In fact, we have a very defined trend line down we can use as a guide. By using this weekly guide, we can monitor when/if Growth is able to gain sufficient strength to challenge Value to a rematch. Until it breaks that trend line, you might think of the classic movie trope - a montage of a losing team running relentless practice drills and enduring grueling hard work, preparing for a rematch. Until this trend line is broken to the upside, Growth will be running wind sprints and lifting weights:
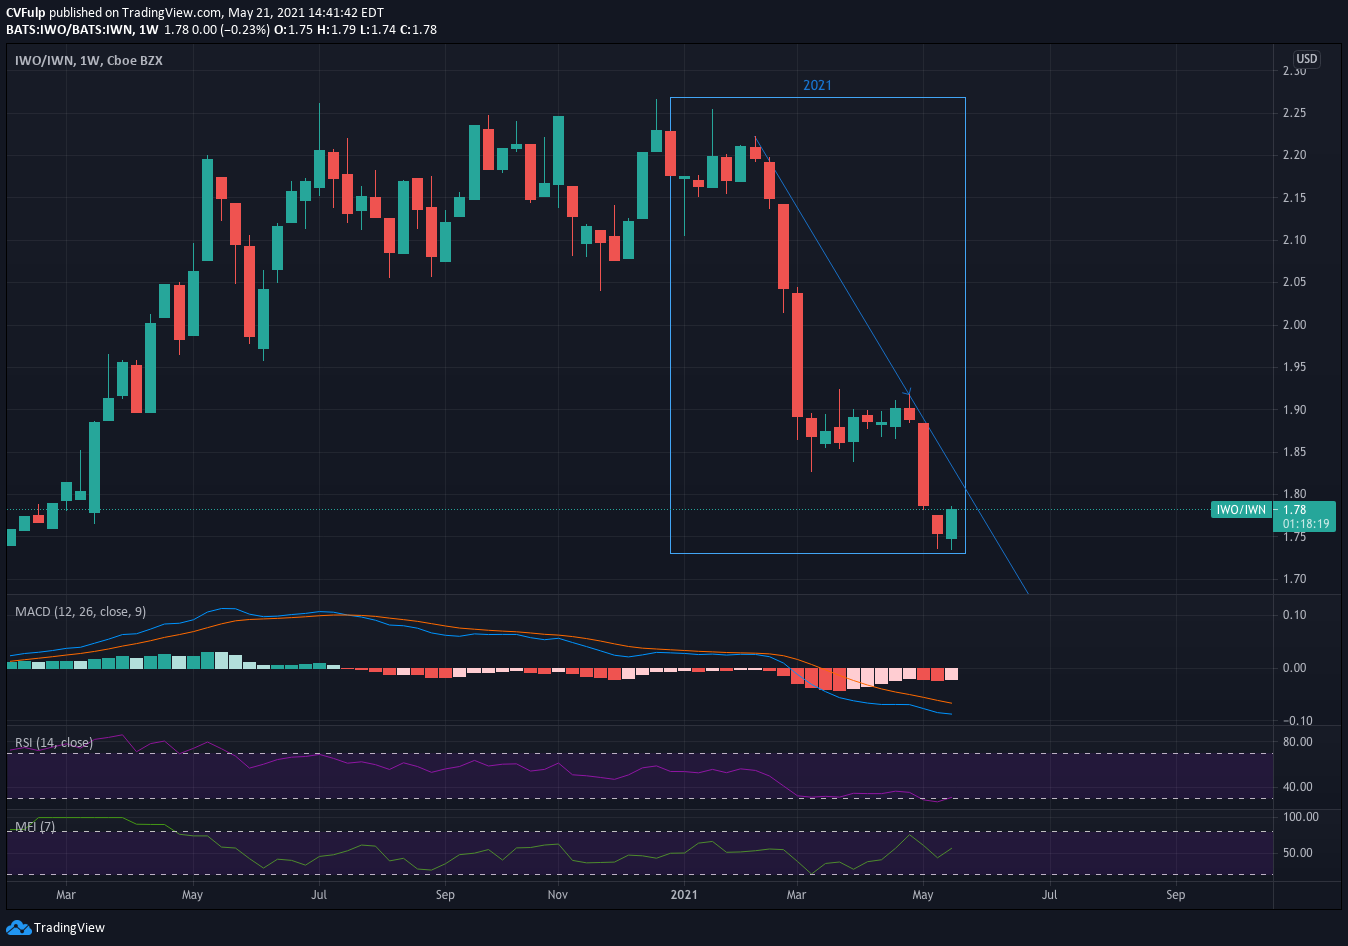
IWO/IWN Weekly Chart with Trendline
Treasury Yields
Next, let’s take a look at what may be a catalyst for equity market weakness in the weeks/months ahead. Following the February 2021 Treasury Auction, markets witnessed a “surprise” spike in 10-year Treasury yields. In the interest of time, I won’t go into significant detail on this concept, but I will highlight that this spike catalyzed the initial wave of stock selling in 2021, especially in the Growth stocks. The 10-year and 30-year Treasury Yields have since been forming their own notable Elliott Wave patterns. If these patterns continue, we should expect another spike up in yields. This could result from any number of possible causes or a combination of causes. I am far less concerned with what causes it, rather I am watching the treasury yield curve, specifically the 10-year yield. A sudden move up should not be a surprise, however, if it were to happen, markets will almost certainly perceive this as a bad omen, resulting in likely selling in the stock market.
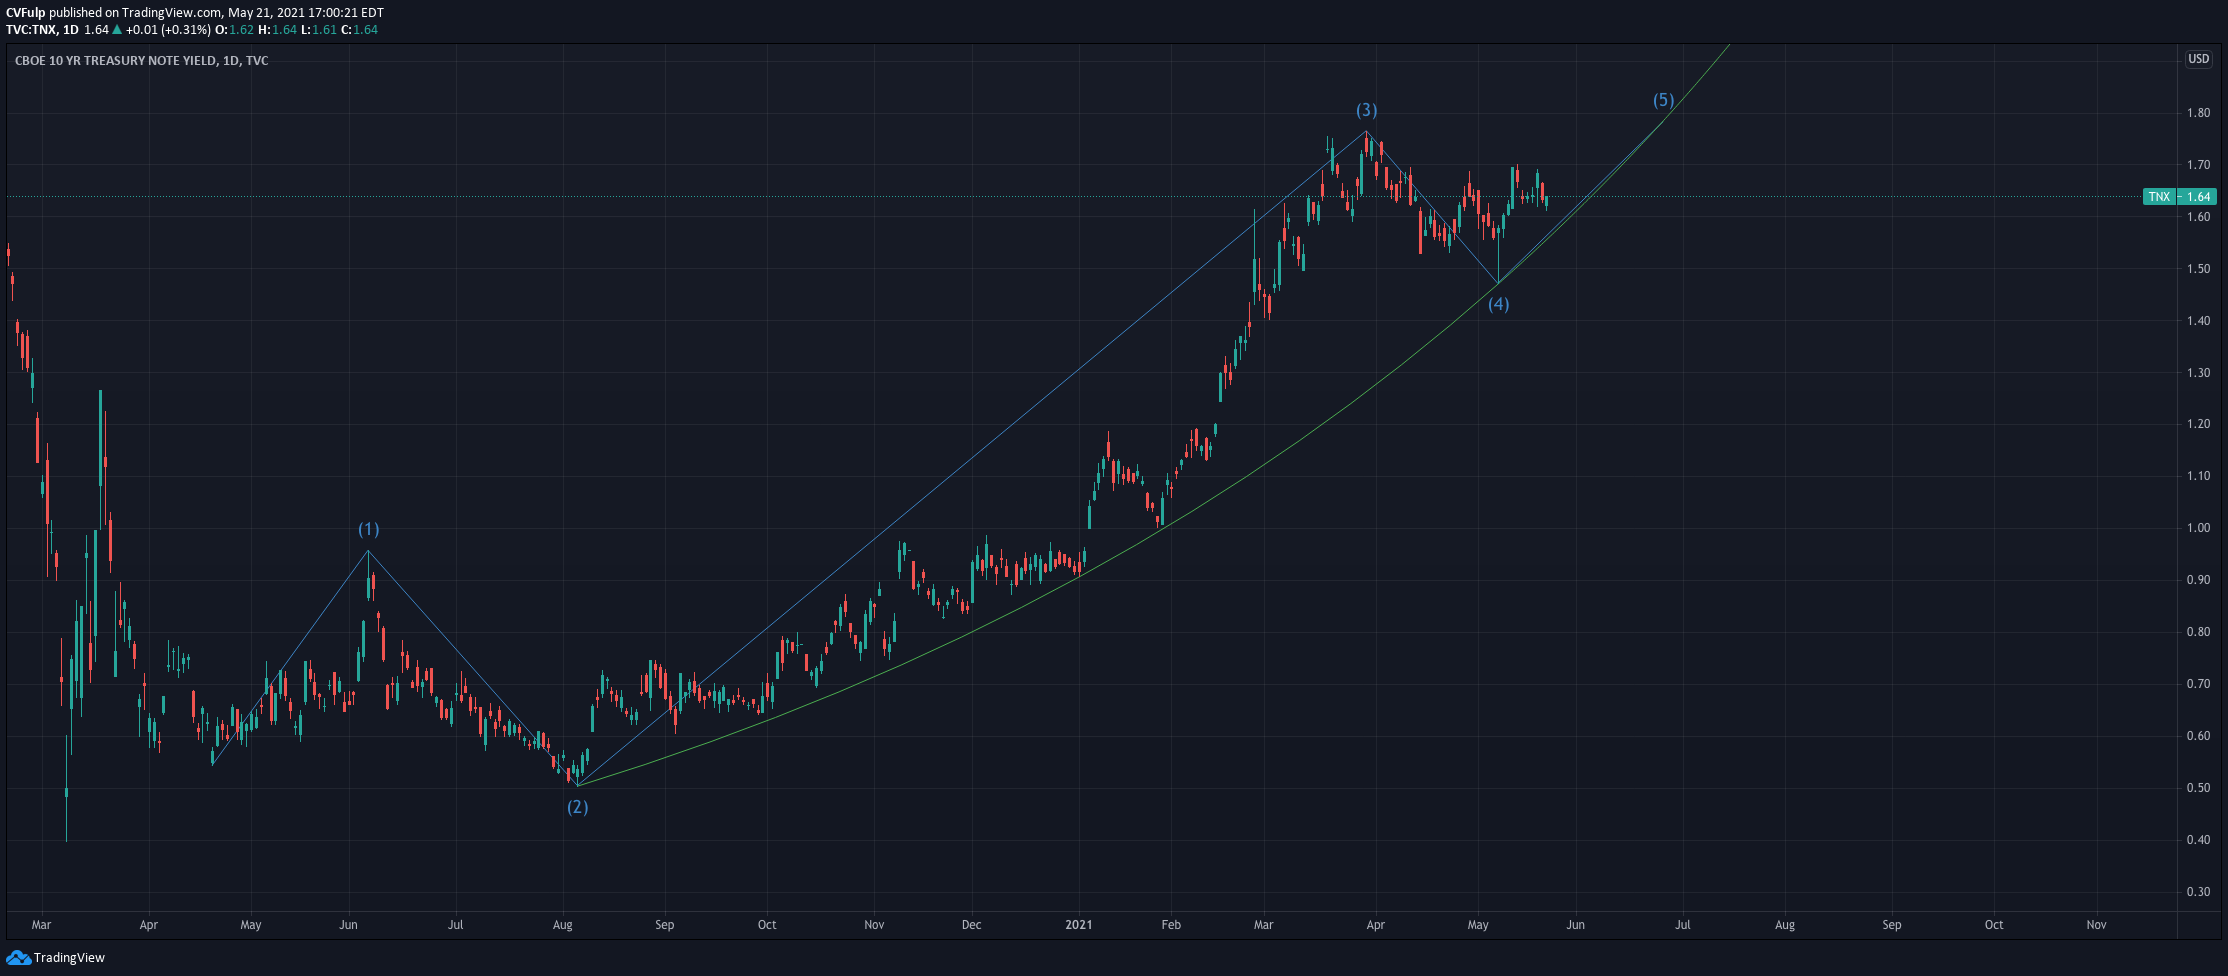
10-year Treasury Note Yield

30-year Treasury Bond Yield
Critical Support & Resistance Levels for Key Market Indices
In addition to the aforementioned NASDAQ-100 (NDX), which I reviewed in the context of Growth vs. Value, there are some additional support and resistance levels on other major market indices I am watching closely.
First, the “old man of Wall Street” - The Dow Jones Industrial Average (DJI)- has had a pretty successful start to 2021, outperforming both the S&P 500 (SPX) and NASDAQ-100 (NDX) by 0.88% and 7.53%, respectively, since the start of the year. This is in stark contrast to 2020, when it underperformed notably. The Dow Jones has formed some compelling supports at 33,788, 33,228, and 31,193. We also have a significant gap that formed between May 10th and May 11th that is likely to be filled, providing a good price target and resistance between 34,572 and 34,741. If this target is reached, but the index does not break out above this range, the support levels should be monitored closely. If the Dow happens to violate the first support, but the second holds, we may expect to see several weeks, even months, of sideways movement in this index. This should not be cause for concern. However, if we see a violation of the second support (33,227), it is likely we will see fairly aggressive selling to follow.

Dow Jones Industrial Average Target & Support
While the major market indices are worth considering, we should also focus on broader markets. To do so, I like to look at the Equal-Weight S&P 500 (RSP) and the Value Line Geometric Index (VALUG). In the case of the Equal Weight S&P 500 (versus the traditional capitalization-weighted index), we have a fairly defined trend line we can use to define when a breakdown may form. So long as this trend line stays intact, we believe markets to be constructive:

Equal Weight S&P 500(RSP) Trendline
An even more revealing story is told by the Value Line Geometric Index (VALUG). This index includes more than 1,700 companies, equally-weighted using a geometric average. This provides a snapshot of the health of the broad stock market, not just a handful of huge companies. The compelling story here is the very defined support/resistance line, initially established by the mid-March highs. This line has been like a magnet reversing polarities - it flips back and forth from being resistance to support and back to resistance. This is relevant as it offers a telling clue about the probable trajectory of the broader markets. At the end of the day Friday (05/21/21), the index closed at 661.73, just 0.42 under the support/resistance line of 662.15. While there is an upward trend beginning to form, until a definitive breakout above this 662 line is observed, we may likely see broad markets moving in a sideways manner. If we do get a break out above the 662.15 level, this level will, again, become a significant support to watch going forward.

Value Line Geometric Index Support/Resistance Line
So, in closing, I will reiterate two of my favorite investor mantra’s:
There are good investments to own and there is a right and a wrong time to own good investments, know the difference.
Follow the Indicators!
As always, please reach out to Carriage House Planning if you have any questions or if you’d like to discuss how you may improve on the steps you’re taking in your financial life. Perhaps we can help you in your journey toward achieving Your Financial Freedom. Email info@carriagehouseplanning.com.