
What Period, Inning, or Quarter Is It?
As a resident of the Tampa Bay Area for almost my entire life, I often looked at cities like New York, Boston, San Fransisco, and Montreal with a sense of wonderment. These cities all boast notable sports franchises with legacy status due to the numerous titles they have won. New York has the Yanks, Boston and their triple threat of the Pats, the Red Sox, and the Bruins, San Fransisco playing home to the Giants and the 49ers, and Montreal home to the Canadiens. Sure, Tampa has a couple of victories and a heck of a Cinderella story with the Rays in 2008, but none of our teams were able to stay on or near the top for more than a year.
I would often ruminate on what the fan experience must feel like having “your team” on the top for years at a time. You are passively riding along on the hard work, commitment, effort, and talents of a group of men or women. Undoubtedly you are emotionally invested, yet have no control over the outcome (despite your most superstitious efforts). I wondered if you are really able to enjoy it, or do you constantly fear what is presumed to be inevitable. You know what they say about being numero uno: There is nowhere to go but down.
In the unlikeliest turn of events, Tampa has managed to upend its own legacy as the redheaded stepchild of professional sports cities, clinching multiples titles, all within the past 18 months!
While this has been very exciting, I no longer wonder about what the sports fan feels. I have learned that this does come with a sense of fear about when the music may stop.
I suspect a very similar concern over when the music will stop is shared by a majority of investors right now, perhaps even yourself. The recent increase in market volatility has some scrambling for the exits, while others race in for the opportunity to find vacant seats, front-and-center. In keeping with the sports analogy, the question on so many minds is, “What period, inning, or quarter is it?”
Unfortunately, there is no Megatron clock showing a clear answer. This has many questioning if they should go ahead and leave to beat the traffic jam? Or is an overtime dual likely to take place? Could the game just be starting? We could try to predict blindly based on our gut feeling, or we can evaluate the evidence available to find clues that may help us better understand the probability of outcomes as we look ahead. For example, are the players drenched in sweat, showing fatigue? Is the field or ice far less pristine than it would be at the start of a game? Are the fans around us teetering to-and-fro, slurring their words as they scream like wild banshees at the ref? If so, this evidence would suggest the game has a higher likelihood of nearing the final whistle or buzzer. However, we may see some players sucking wind, while others are fresh as a spring daisy, and the fan sitting next to you is still gingerly nursing a beer with a fresh, whole hotdog in hand. There is no certainty in the matter, but one could surmise that much more game has yet to be played, and leaving now would not be favorable.
With this analogy in mind, I believe the following clues can offer a greater understanding of the probable direction for the broad investment markets.
Economic & Political Conditions
“Flations” (not to be confused with flatulence)
So, which is it? Inflation, Deflation, Reflation, or Stagflation?
These four terms are being used somewhat excessively in news media and even in regular conversations between average Americans, but to little effect. A general misunderstanding of these terms exists, perpetuated by pundits and newspaper opinion articles that overcomplicate these concepts, manipulating their definitions to support the point they are trying to make. Instead, let’s just plainly define them for what they are:
Inflation: Too much money chasing too little goods/services/products. Results in price increases.
Deflation: Too many goods/services/products, but not enough money to buy them. Results in price decreases.
Reflation: Fiscal (Congress) or Monetary (Central Bank) policies used to combat pressures or threat of Deflation.
Stagflation: Slow or no economic growth, high unemployment, and Inflation all at the same time. (This one didn’t even exist until after the 1970s. Prior to that, economists insisted there was no way to have inflation and high unemployment at the same time, but then it did happen).
The Federal Reserve has been fairly assertive in its stance that inflation is transitory, or temporary, as a result of the pandemic-inspired government shutdown of economic activity. This belief has informed their decision to maintain artificially suppressed lending rates, as well as steadily increasing their balance sheet with an array of asset purchases, thereby “stimulating” the economy. The Federal Reserve has been in the Reflation camp for more than a year now, however, their tune has been changing month by month as they are finally realizing that Deflation was never the enemy on the battlefield. As you might imagine, when entire economies have been forced to shudder, there is not an excess of goods/services/products being manufactured. Simultaneously, when the Fed+Treasury is printing money and sending checks to Americans in exchange for zero economic output, there is little risk of there being too little money chasing too many products.
While the Federal Reserve has the loudest voice in shaping the “Flation” conversation, the astute American deafens their ear to the “assurances” coming from the Fed, focusing instead on the reality they live in every day. Doing so allows one to determine which “Flation” pressure is really at play. Then, adjustments can be made in financial planning assumptions and in portfolio decisions that are rooted in empirical evidence and truth, rather than the empty words of central bankers who have checkered pasts, at best.
We know that food and gas prices are higher now than they have been in recent memory, but these are not considered in the official calculation of inflation. However, one inarguable factor that ultimately impacts the cost of almost any good is shipping container rates. Shipping container rates remain at historical highs. While not directly indicative of anything, it is a great bellwether for how international trade has been, is, and will continue to be impacted by supply chain disruptions. Supply chain breakdowns, alone, (especially on a global scale) will stimulate inflation. Usually, they occur in a specific region of the globe, so broader inflationary pressures are not a concern, however, this is not the case in our current environment. The more reliance a country has on importing goods/services (raw or final), the more these inflationary pressures will impact that nation. The United States happens to be a country highly dependent on imports.

Additionally, it is worth looking at the current state of Consumer Price Indices (CPI). Below, we can see the aggressive ascent in the Consumer Price Index for all Urban Consumers in both all items EXCLUDING food and energy, as well as the cost of food. The bars at the bottom of each reflect the 21-week rate of change. So not only are these consumer prices going up, but they are going up by a greater degree each week.

Conclusion: 🛑 Extreme caution is warranted. At first inflationary conditions act as a tailwind to equity markets; However, this honeymoon period is typically less than 12 months, at which point selling pressures mount on fears of future cost increases. This can paralyze production and therefore future earnings begin to suffer. Generally, this type of environment is negative for markets over the forthcoming 12 months.
The Politicization of Health to Win Votes
Unfortunately, it has become apparent that a new trend is emerging in the politicization of Public Health. While not entirely new, the general bifurcation along party lines of public health policy has advanced drastically over the past few years in lockstep with the general polarization of many aspects of daily life. I’m old enough to remember when “Anti-Vaxxers” were earthy, hippy-dippy, “fight the man” progressives. Yet nowadays, this pejorative is pointed at anyone who does not have complete, unquestioning faith in unelected government officials, corporations with clear incentive models, or The Science™️. It also happens that these same people, regardless of their individual beliefs, are assumed to be a member of one specific political party. The line is thus drawn, and the politicians know it. Not only a shame, but this development has created a new risk on the economic spectrum.
Policymakers are incentivized by two major forces:
Votes
Lobbyists (a.k.a. The Creatures from the Dark Lagoon)
By drawing a party-line down the middle of public health, a direct conflict emerges: The focus is no longer on the health of the public and the policies that achieve this goal in the most appropriate and constitutional manner; Rather, the focus immediately shifts to determining the most effective means for achieving the votes of the next election cycle. The government has used the “You must fear this great health threat, but vote for us and we will make it better” to great effect while further diminishing the American Individuals’ right to assess risk/reward paradigms and make decisions for him/herself and that of their loved ones. This trend does not seem to be slowing, especially with mid-term elections soon to be forced into the public psyche.
This presents risks to markets and economic conditions as another government-mandated closure of businesses they decide are not “essential” remains a looming threat. While not directly impactful to some segments of the market (whichever the current government’s decision-makers deem “essential”), the economy as a whole will not likely weather another storm of this nature without catastrophic consequence. The potential impacts of this risk need to be accounted for as we look toward the future. Investing internationally as a hedge against domestic political risks presents one way to mitigate this threat.
Conclusion: ⚠️ A cautious and watchful eye should be trained on COVID-related policy decisions. Pfizer and Moderna are more than happy to see politicians scaring the pants off citizens, insisting they get a vaccine that remains in Emergency Use Authorization (EUA) status, technically not officially approved by the FDA for use. This has and will benefit their revenues, but generally, this uncertainty in future policymaking will be a burden on most companies. Some are choosing to mandate vaccination while others are not. This will lead to continued divergences, defining clear winners and clear losers. In other words, so long as this public health issue remains so politicized, there is no rising tide lifting all boats as we saw from March ’20 to April ’21. The tide will ebb and flow, without much rhyme or reason and will likely prove difficult to predict. Markets care much less about whether things are good or bad. Markets care if things are getting better or worse. Uncertainty is the market’s worst enemy.
Market Conditions
Breadth in a Funnel
When volatility in the major indices begins to appear as it did in July, we want to look at conditions like breadth to understand whether the ups and downs are being experienced by all stocks large and small, growth and value, or if the ups and downs are characteristic of some while not of others. In the case of the past month, the new highs reached by the S&P 500 and Nasdaq 100 can both be attributed to a small list of companies - those pesky big tech companies we have all been paying attention to for the past few years.
Monitoring indicators like the NYSE HiLo indicator and the NYSE Advance/Decline ratio evidence suggests the resilience experienced by the major indices has not been shared by the majority of stocks. Instead, it has been isolated to the largest companies, most of which are tech-focused.
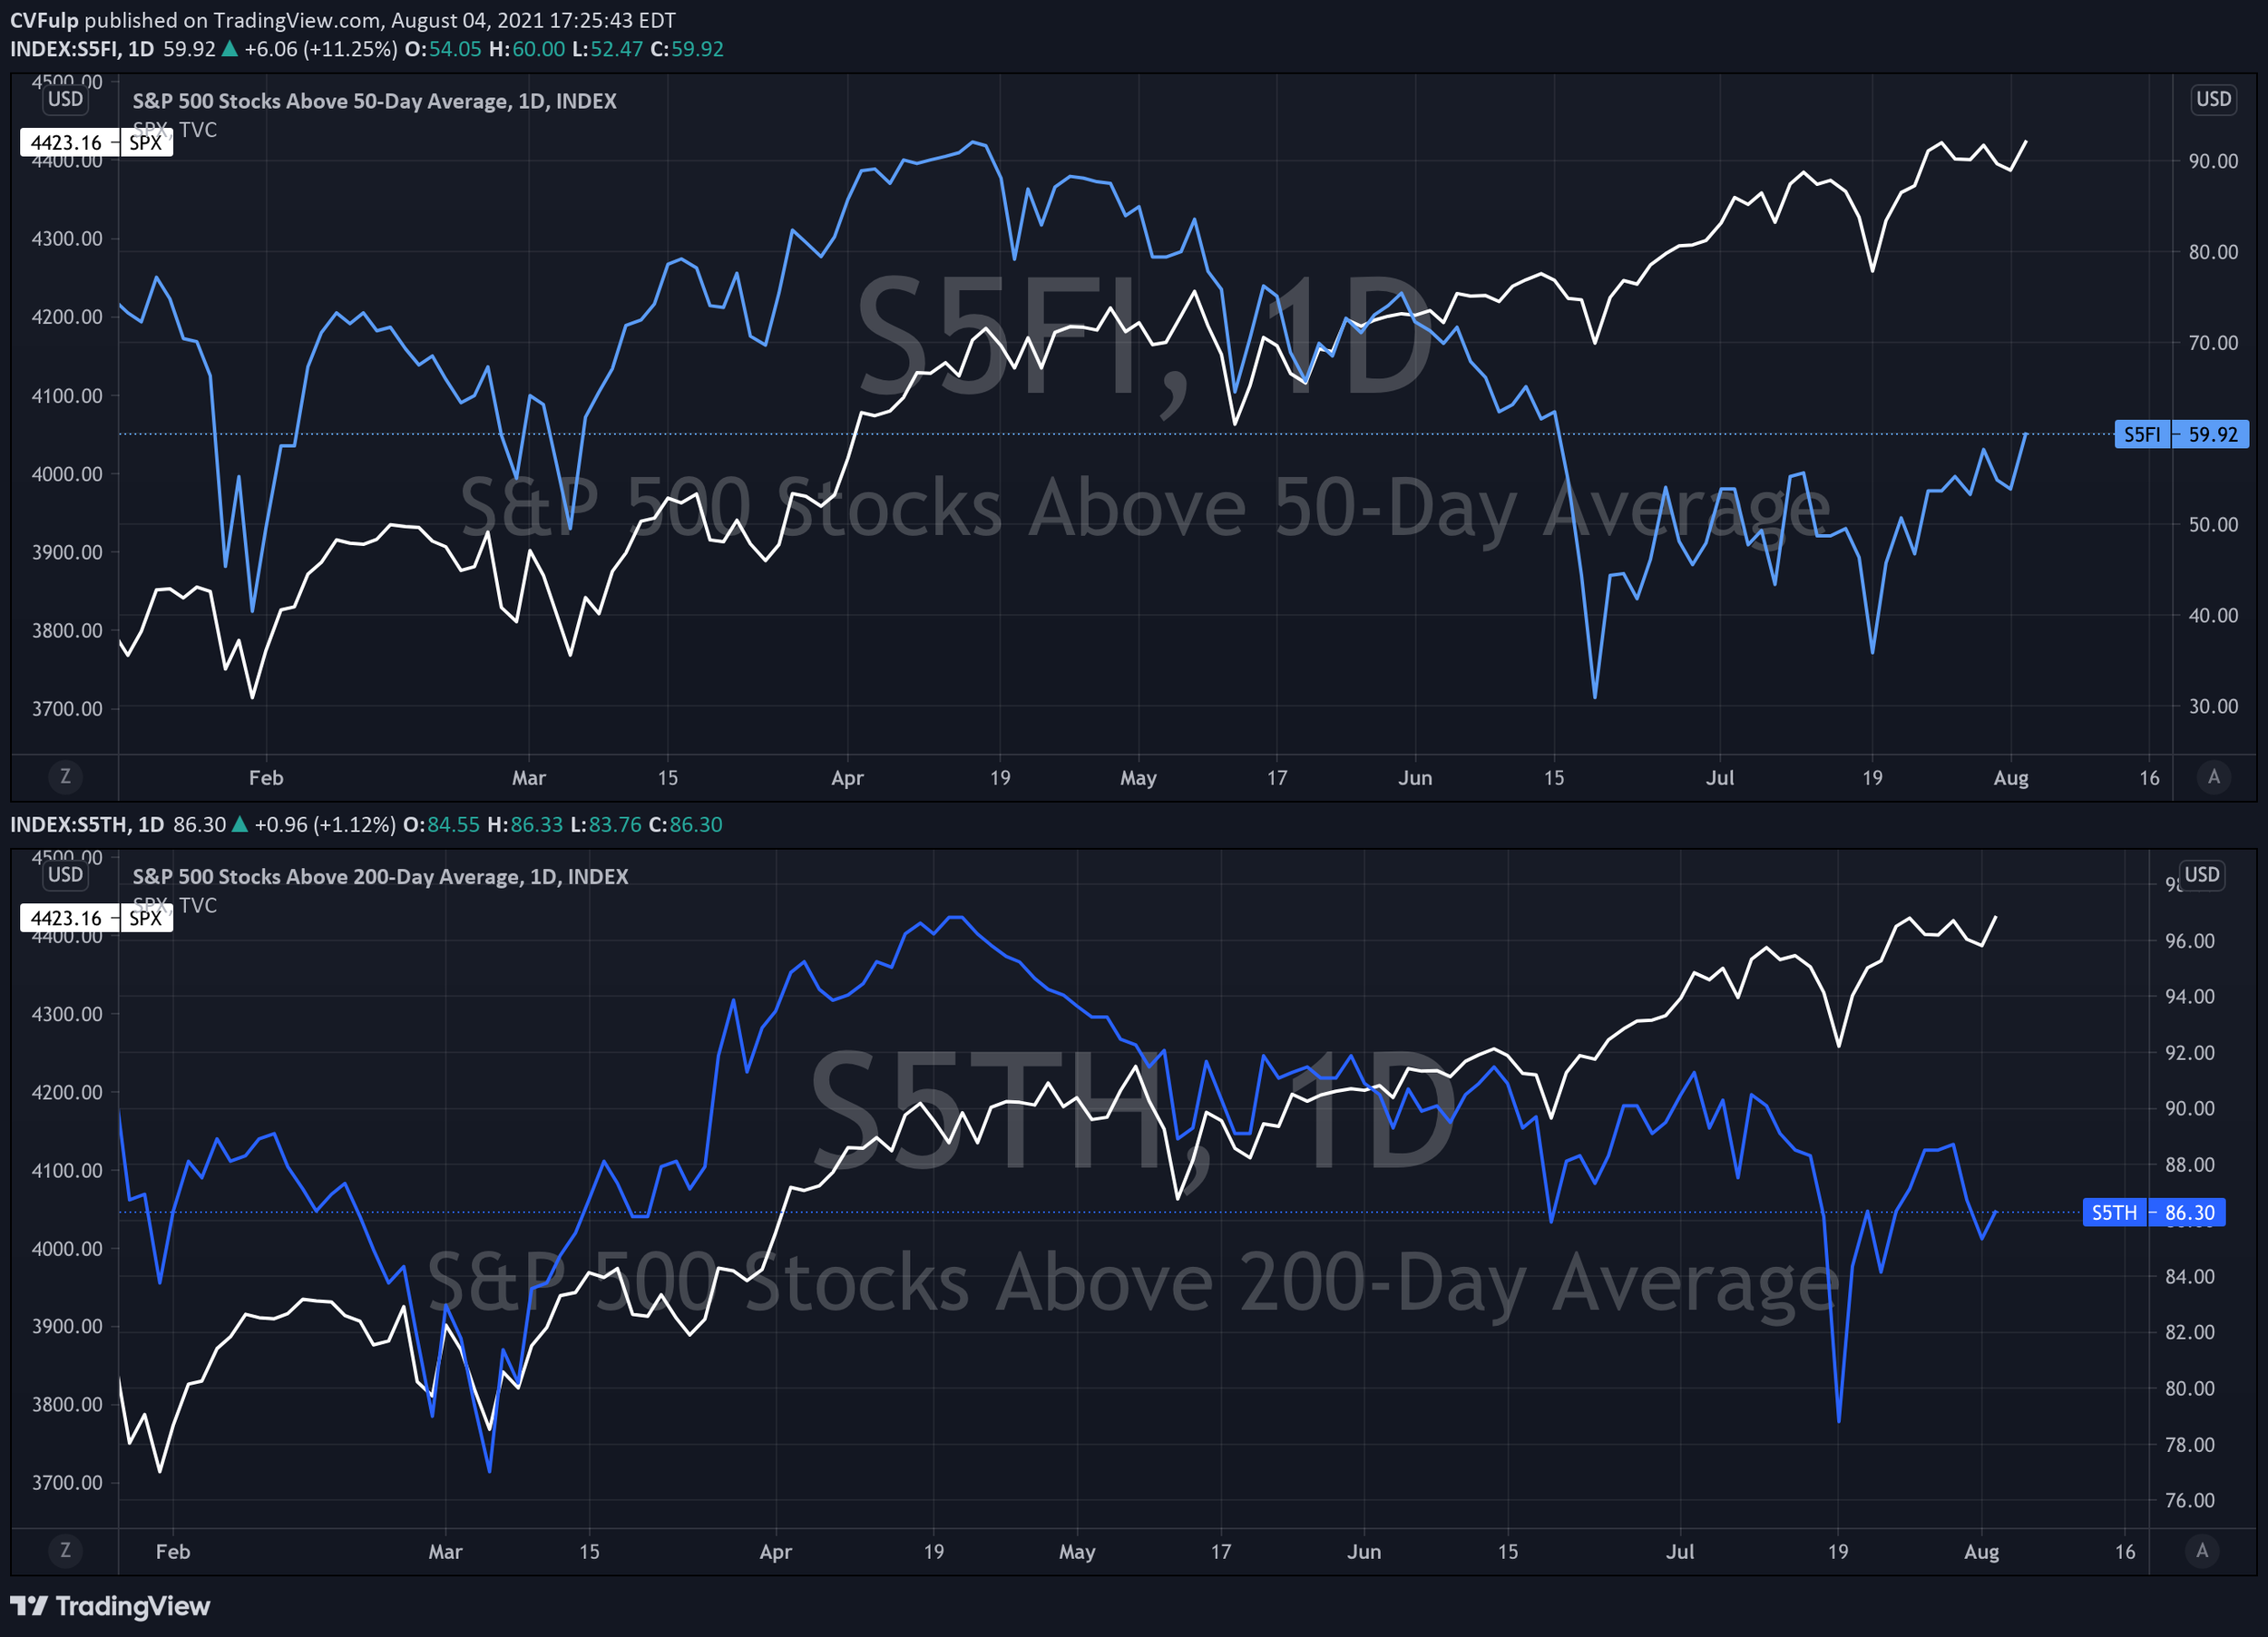
Another way to visualize this is to look at the S&P 500 stocks trading above their 50-day moving average and 200-day moving averages. We know the S&P 500, itself is trading above these averages as it has recently reached new all-time highs, but how many of its constituents are sharing in that recent success? The chart below shows only 60% of the stocks in the S&P 500 are trading above their 50-day moving average while 86% remain priced above their 200-day moving average.
Conclusion: ⚠️ While this does not directly suggest anything positive or negative, it is generally less constructive to have a few stocks pulling the whole market. We did see this occur in the months following the shutdowns, as the big tech names lead the market up from the selling in March 2020, but this was bolstered by companies getting back to work as restrictions were lifted. We are now in a different environment, suggesting this lack of breadth is less than positive.
Historically Speaking: Market Strength Builds on Market Strength
On a more positive note as of July 30th, the S&P 500 has experienced six consecutive positive months. A study conducted by LPL Financial looked at the S&P’s performance following at least 6 positive consecutive months and the results are surprisingly positive. With the exception of a few negative periods, the subsequent 1, 3, 6, and 12 month periods are overwhelmingly positive.

While I do see this as a positive, the lawyers would not be happy if I failed to remind you that past performance is in no way indicative of future returns. I’d also like to bring your attention to the period outlined in yellow. Note that this period has the most significant negative performance in the subsequent 12 months following the period of strength. This is a notable period (especially for those who remember in the early ’80s) as this is when Fed Chair Paul Volkert was tasked with “breaking the back of inflation”. Hyperinflation had roiled global markets and extreme monetary tightening (raising the Federal Funds rate) was deemed necessary to pump the brakes. Not only did this set the stage for the longest bond bull market in history, but it also showed the negative impact of inflation when it overheats. It can be positive at first, but if it gets out of hand, hard choices have to be made, which may result in lending rates in the teens as well as less than desirable performance in the S&P. While not a certainty, this risk does exist and is being accounted for.
Conclusion: ✅ Generally positive, with the asterisk of inflation and monetary policy decision making.
Similarities between Chinese Markets and the Chinese Flag - Both are Red
Chinese markets have experienced bouts of selling over the past few weeks. After being up almost 6% for the year in February, the Shanghai Composite Index (SSE) has suffered a series of aggressive sell-offs now down for the year by a little over 1%. Most recently, the index declined by more than 6% over the course of 4 trading days in July. This weakness and volatility in Chinese markets presents a risk of catalyzing broader global selling as witnessed in 2015 and 2016. The following shows the extreme selling in the Shanghai Composite Index (red line) that started in June of 2015, followed shortly after by significant selling in the S&P 500 (blue line).

SPX & SSE 2015-2016
If we look at a comparison of the same two indices in the current market, we can see the aforementioned selling in the Chinese markets, however, our leading domestic index has not followed in its footsteps. A primary factor in the 2015-2016 selling had to do with a currency war, of sorts, waged by the Chinese on the US and other global market players. While this theme is not present on the surface, there are rumblings of speculation that such risks may present themselves.

SPX & SSE 2021
Conclusion: ⚠️ Weakness in Chinese stocks is a headwind for global markets and should be watched closely. The Chinese government has a history of intervening aggressively when volatile conditions persist. Emerging market funds will be most impacted and should therefore be analyzed closely for exposure to high-risk regions. Conditions are improving, however, recent reports of Coronavirus in major Chinese cities may further impact any recovery in their markets.
So, what period, inning, or quarter is it anyway?
I’ll admit, I may have buried the lead a little. From the start, I have supplanted the idea that we should focus our attention on how long we might have left in the game but the truth is, this question is of little consequence. The real question that should matter to investors is how far along are we in the season? Games matter very little in the grand scheme for investors. Losses last only as long as the period between games UNLESS that loss comes at the end of the season or in the playoffs. I would liken the end of a season and the ensuing off-season to be equivalent to a 2008-2009 market, or even a February-March 2021 (a significantly short off-season, much like that of the Tampa Bay Lighting this past year).
At this point, there is little evidence to suggest we are at the end of the season or in the playoffs. There is, however, a good chance we will see a loss or two, maybe even a small losing streak over the coming months. The conditions we have discussed here, in addition to several others, present us with the reality that upside resistance is much stronger than downside support. That being said, one of the best qualities a market can exhibit after ascending for a prolonged period of time is a sideways consolidation - basically, if markets go up and down a little here and there, but don’t make any big moves in either direction, this can be very positive.
At this point, it would be prudent for investors to consider paring down some of their portfolio risk, but not advisable to exit markets entirely. Now that we are in August, major tax law legislation is not likely to be passed this year, so some capital gain harvesting could be in order. Additionally, with the Federal Reserve resuming their annual in-person meeting in Jackson Hole, WY later this month, we could see messaging emerge that proves volatile to short-term markets, yet bullish and far more sound for long-term economic conditions.
Wishing you happiness and prosperity,
Casey V. Fulp, CFP®️